

Dividing total batch demand by batch time is the single most consequential mistake in pharmaceutical utility design, and the most reliable cure is dynamic simulation of overlapping schedules.
Several years into the operating life of a large biopharmaceutical manufacturing facility, the symptom was familiar to anyone who has run a multi-product biologics plant: scheduled batches were quietly slipping, CIP cycles were waiting in queue for water, and the supervisory system kept flagging Water-for-Injection (WFI) loop pressure dips during shift transitions. The root cause sat one level deeper than operations could reach. It had been baked in at the design phase.
The facility’s WFI generation and storage system had been sized by a method depressingly common in front-end engineering: take the total WFI consumption per batch, divide it by the batch duration, and call the result the “design flow.” Add a notional safety factor, usually 1.3 to 1.5, and specify a still and storage tank against that number. The number is wrong. Not slightly wrong; wrong by a factor that, in this case, cost the site roughly 40% of its nameplate batch capacity until an emergency retrofit added a second water treatment train.
I ran into this failure mode a few years ago, when we were planning to step up the site’s manufacturing capacity. Correcting it took more than challenging the basic sizing assumptions. New products introduced onto platform-designed facility often bring process requirements that push water demand even higher. This isn’t something operators or maintenance can fix, and it isn’t a regulatory gap — it’s a design problem, rooted in a refusal to model demand the way batch manufacturing actually generates it.
Continuous, back-to-back biologics production is the operating mode utility designers must size for, and it is the regime in which averaging breaks down. In a single upstream-plus-downstream cycle, WFI is drawn for media preparation, buffer preparation across multiple chromatographic steps, Clean-in-Place (CIP) of bioreactors and harvest tanks, CIP of chromatography skids, and pre-use rinses on final fill equipment. Each of these draws has its own flow profile: media prep is steady and modest; CIP is short, intense, and high-flow; buffer prep is moderate and recurring.
When batches run staggered — a campaign of six to eight back-to-back runs is typical — the draws of one batch overlap with the draws of others. The CIP of the harvest tank from batch N can occur in the same fifteen-minute window as buffer prep for batch N+1 and the pre-use rinse on the final fill skid from batch N–1. The instantaneous WFI demand at that window can be three to five times the batch-averaged number. The storage tank empties; the generation system cannot keep up; the next scheduled draw waits, and the schedule slips behind itself.
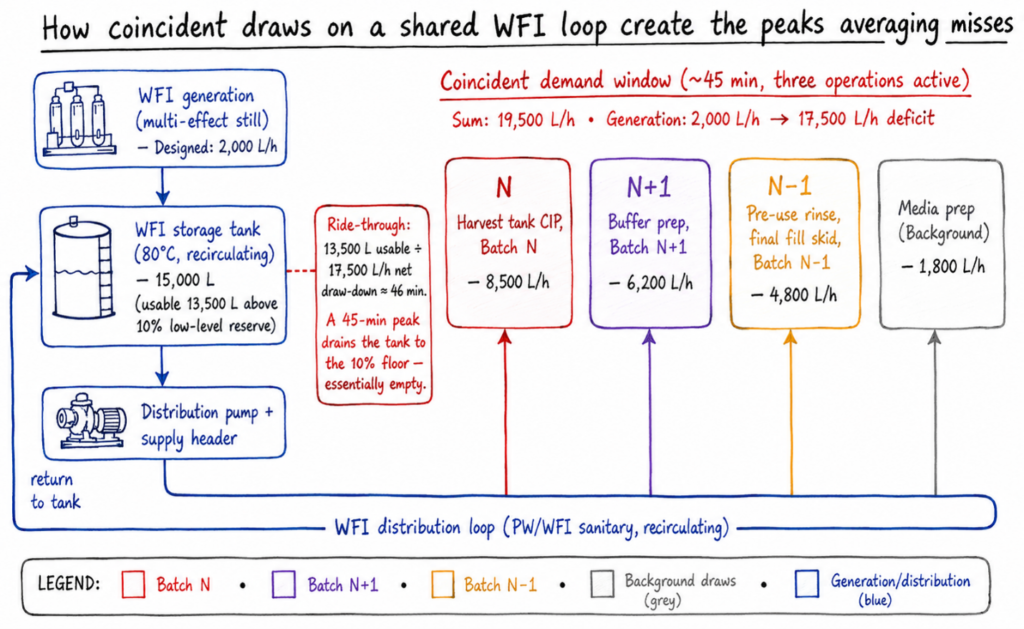
Figure 1. Schematic of coincident WFI draws on a shared distribution loop. Operations from three overlapping batches (N, N+1, N–1) can demand 19,500 L/h simultaneously against a WFI generation rate of 2,000 L/h, a 17,500 L/h deficit the storage tank must absorb. The 15,000 L tank holds a 10% low-level reserve, leaving only 13,500 L available to draw; at a 17,500 L/h net draw-down that buffer lasts about 46 minutes. A 45-minute coincident peak draws it down to roughly 375 L above the low-level alarm, essentially empty. Storage volume does not prevent the shortfall; it only delays it by about three-quarters of an hour.
Averaging hides this entirely. A 100,000-litre batch demand spread over a 20-day cycle averages to about 5,000 L/h. The actual instantaneous demand at coincident peak, observed in the case described above, exceeded 20,000 L/h for periods of 20–40 minutes. A still and loop sized at just 2,000 L/h cannot serve a 20,000 L/h peak no matter how large the storage tank, unless the storage was sized to ride out every peak in the campaign without refilling. It never is, because storage volume is constrained by turnover requirements in ASME BPE-compliant distribution loops. Storage only buys time, and not much of it: once a low-level reserve is set aside, the usable volume divided by the net draw-down rate fixes the ride-through, and against a deficit of this size that ride-through is measured in tens of minutes, not hours.
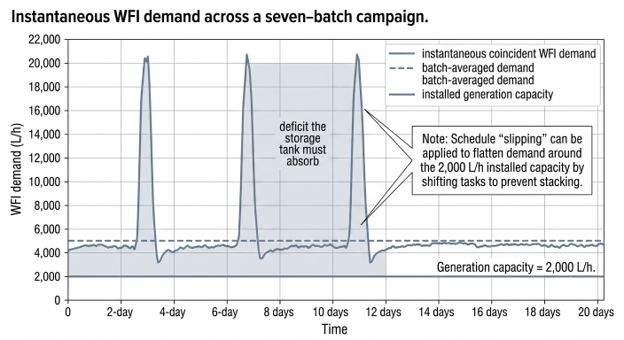
Figure 2. Instantaneous WFI demand across a representative seven-batch campaign. Batch-averaged demand (dashed) sits near 5,000 L/h; coincident peaks (solid) exceed 20,000 L/h during three windows when CIP, buffer prep and pre-use rinse stack. The system, with a generation rate of just 2,000 L/h, cannot serve the peaks, and the schedule slips to flatten around the installed capacity. That gap is the mechanism of the 40% capacity loss.
The reason peak demand cannot be derived analytically is that it depends on the schedule, not the recipe. The same batch recipe, run as a single isolated batch, has a very different peak demand than the same recipe run as the sixth in a back-to-back campaign. Coincidence between unit operations across batches is what creates the peaks, and coincidence is a function of cycle times, queue management at shared equipment, and the operator scheduling logic, none of which a static demand calculation captures.
Dynamic discrete-event simulation does capture it. Purpose-built tools or batch simulation tools execute the production schedule across a full campaign, log every demand event at one-minute resolution or finer, and produce demand curves like the one above for each clean utility: WFI, pure steam, plant steam, process chilled water, instrument-quality compressed air, and oxygen-free nitrogen. Each utility has its own coincidence signature. WFI peaks during CIP-and-rinse stacking; pure steam peaks during simultaneous Sterilization-in-Place (SIP) cycles; chilled water peaks during cooling of multiple vessels post-CIP. Sizing each utility against its own coincident peak, not a batch average, not a campaign average, is the only method that survives commissioning.
The cost of doing the simulation is two to four engineering weeks during front-end loading (FEL). The cost of not doing it, in the case at hand, was an additional water treatment plant, the qualification effort to integrate it, and a significant capacity hit on the existing asset until that retrofit was installed. The ratio is rarely close.
Utility sizing sits at the boundary between process engineering and facilities engineering, and in many EPC contracts the boundary is also the contractual seam. Process engineers own the batch mass balance and produce a “WFI per batch” number. Facilities engineers receive that number and size a system. Neither side owns the temporal profile, and the User Requirements Specification rarely demands one. The result is a calculation that would never pass scrutiny in process design — no one sizes a bioreactor cooling jacket against average heat duty — applied uncritically to utilities because the deliverable handed across the seam is already averaged.
The guidance has been explicit for two decades. ISPE Baseline Guide Volume 4 on Water and Steam Systems states peak demand, not average, as the design basis [1]. ASME BPE-2022 reinforces the distribution-loop implications [2]. EU GMP Annex 1, revised in 2022, raised the availability bar further for clean utilities in sterile manufacturing [3]. The failure is in execution, not in the standards.
Three things follow if peak demand becomes the design basis rather than a courtesy check at the end of basic engineering.
The URS specifies that the bidder must supply a dynamic simulation of coincident demand across the full intended campaign mode, not a spreadsheet calculation. At times, experience based peak estimation shall be considered for the known platform design but it is always good to verify with the simulation. The generation system is then sized to the 95th percentile of instantaneous demand observed in that simulation, with storage volume sized to ride out the 99th percentile for the chosen generation refill rate. Finally, the schedule itself is treated as a design parameter: if a small change in CIP queue logic flattens a peak by 30%, that change is locked into the master batch record, not left to operator discretion shift by shift.
The limits are worth stating plainly. A single-site case is not a generalization, and the 40% capacity loss observed here is at the upper end of what averaging-based sizing produces; smaller facilities with less coincidence may see 10–20%. The simulation itself depends on accurate cycle-time data, which young facilities do not have, and the model is only as honest as the campaign mode it assumes, a facility scheduled differently in production than in design will see different peaks. None of these limits change the conclusion. They change the engineering rigour the simulation deserves.
When a facility loses 40% of its capacity to a sizing error, the meter on the WFI loop shows it before the spreadsheet does. The number on the spec sheet was always going to be wrong; it was derived from a method that cannot produce the right answer. The interesting question is not why this particular facility got it wrong. The interesting question is why we keep training the next generation of designers in the same arithmetic. Peak demand is not a refinement of average demand. It is a different quantity. None of this is a licence to over-build: sizing to the coincident peak means right-sizing the system, not padding it. Experience has to be combined with the simulation to guard the opposite failure — an over-designed critical utility carries its own penalty in routine sanitization, additional PM cycles, and a standing maintenance overhead that never shows up in the capital estimate. The sooner design conventions reflect that, the less often we will pay to retrofit what could have been sized right the first time.
[1] ISPE Baseline Guide Volume 4: Water and Steam Systems, 3rd Edition (2019). International Society for Pharmaceutical Engineering.
[2] ASME BPE-2022, Bioprocessing Equipment Standard. American Society of Mechanical Engineers, 2022.
[3] EudraLex Volume 4, EU GMP Annex 1: Manufacture of Sterile Medicinal Products. European Commission, August 2022.

Passionate biopharma professional and founder of Bio Pharma View, dedicated to sharing industry knowledge, practical experiences, and insights from the pharmaceutical and biotechnology sector.